
Fuel economy: how to measure yours, and what quietly makes it worse
The fill-to-fill method that gives you a true figure, how litres per 100 km and mpg line up, and the habits that cost the most, with the numbers from fueleconomy.gov.
The figure on the dashboard is the car's own estimate. The number that tells you what your car really uses comes from the pump: how much fuel went in, and how far you drove on it. Once you have it, you can see what your habits cost, and spot the day something changes.
Measure it fill to fill
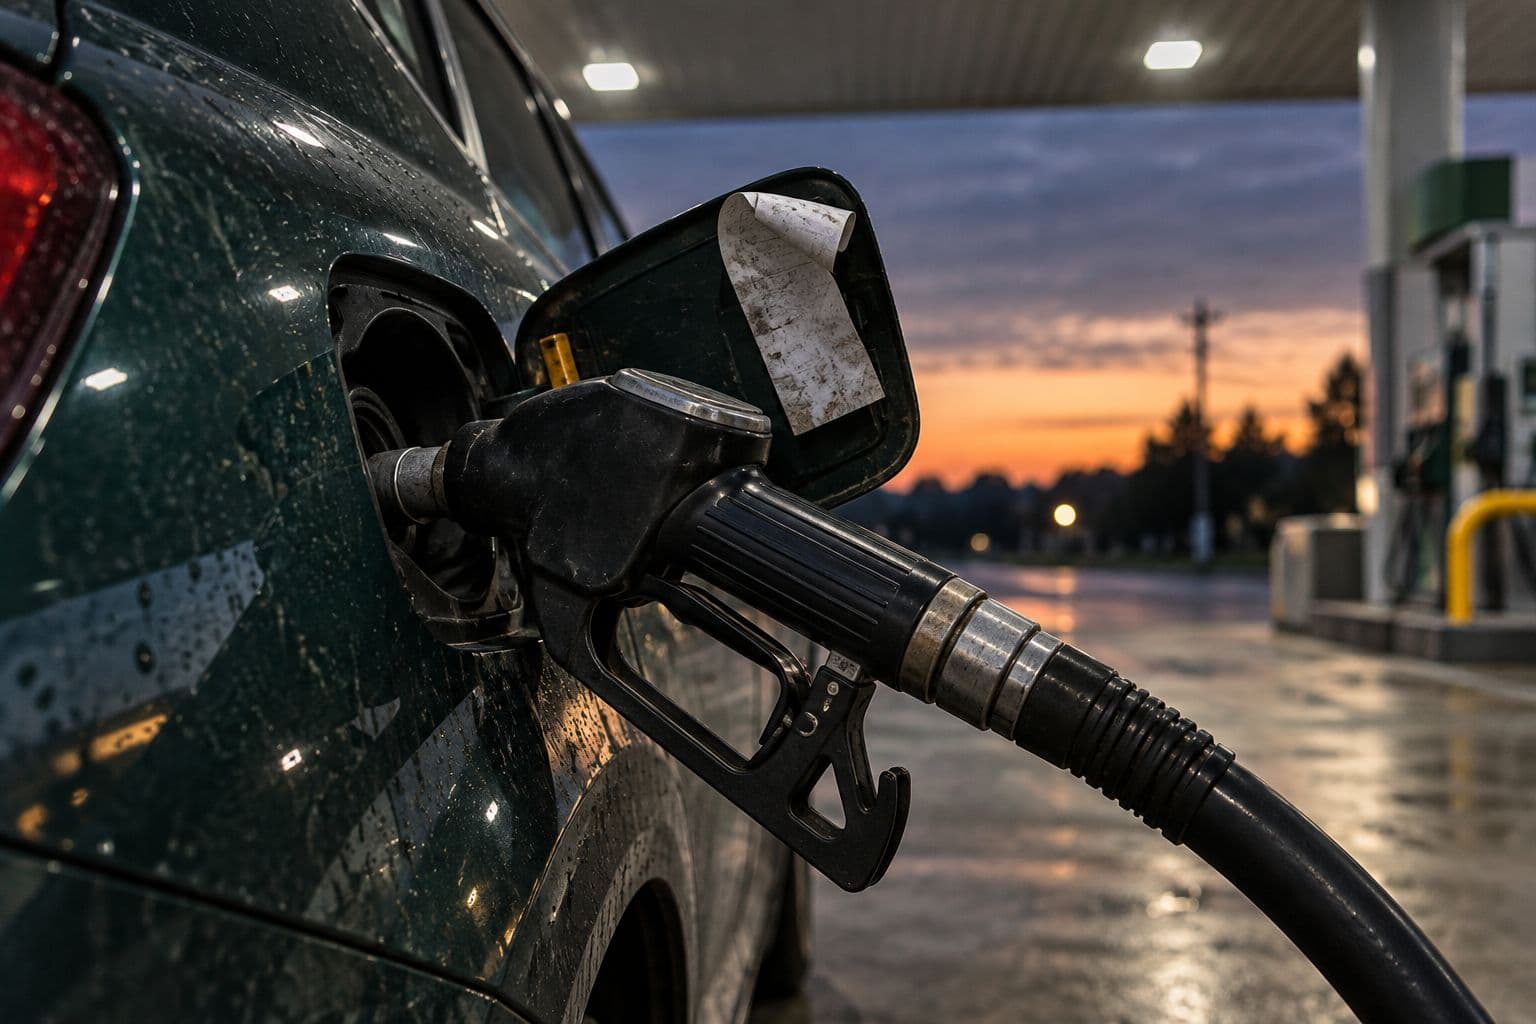
- Fill the tank until the pump clicks off, and note the odometer.
- Drive as you normally would, for most of a tank.
- Fill up to the click again. Note how much fuel went in and the distance since the last fill.
- Divide. In litres per 100 km: fuel ÷ distance in km × 100. In miles per gallon: miles ÷ gallons.
Say the second fill takes 12.7 gallons after 368 miles: 368 ÷ 12.7 = 29.0 mpg. The same fill in metric is 48.1 litres over 592 km: 48.1 ÷ 592 × 100 = 8.1 L/100 km.
Two things keep the figure honest. Fill to the same point each time, the first click, so the tank is equally full at both ends. And average a few tanks: a long highway trip, a cold snap or a week of short school runs can each move a single tank's figure a long way.
Litres per 100 km and mpg
They count the opposite way round. Litres per 100 km is fuel used for a fixed distance, so lower is better. Miles per gallon is distance for a fixed amount of fuel, so higher is better. To go from one to the other, divide 235.215 by the number you have.
- 4 L/100 km
- 58.8 mpg
- 5 L/100 km
- 47.0 mpg
- 6 L/100 km
- 39.2 mpg
- 7 L/100 km
- 33.6 mpg
- 8 L/100 km
- 29.4 mpg
- 9 L/100 km
- 26.1 mpg
- 10 L/100 km
- 23.5 mpg
- 12 L/100 km
- 19.6 mpg
- 15 L/100 km
- 15.7 mpg
The scale isn't even, and that matters most on a thirsty car. Going from 12 to 10 L/100 km saves twice as much fuel as going from 6 to 5, though both cut consumption by a sixth. In mpg it looks the other way round: 19.6 to 23.5 mpg against 39.2 to 47.0.
What makes it worse
fueleconomy.gov, run by the US Department of Energy and the EPA, publishes how much each habit can cost. Driving style dwarfs the rest.
- Aggressive driving, in stop-and-go traffic10–40%
- Aggressive driving, at highway speeds15–30%
- A roof-top cargo box, at 65–75 mph10–25%
- A roof-top cargo box, on the highway6–17%
- The wrong grade of motor oil1–2%
- An extra 100 lb on boardabout 1%
A few more from the same pages:
- Speed. Economy falls away above about 50 mph: each 5 mph over 50 is like paying an extra $0.31 a gallon, at the $4.47 a gallon the site assumed in October 2026.
- Idling. An idling engine uses a quarter to half a gallon an hour, depending on its size and the air conditioning.
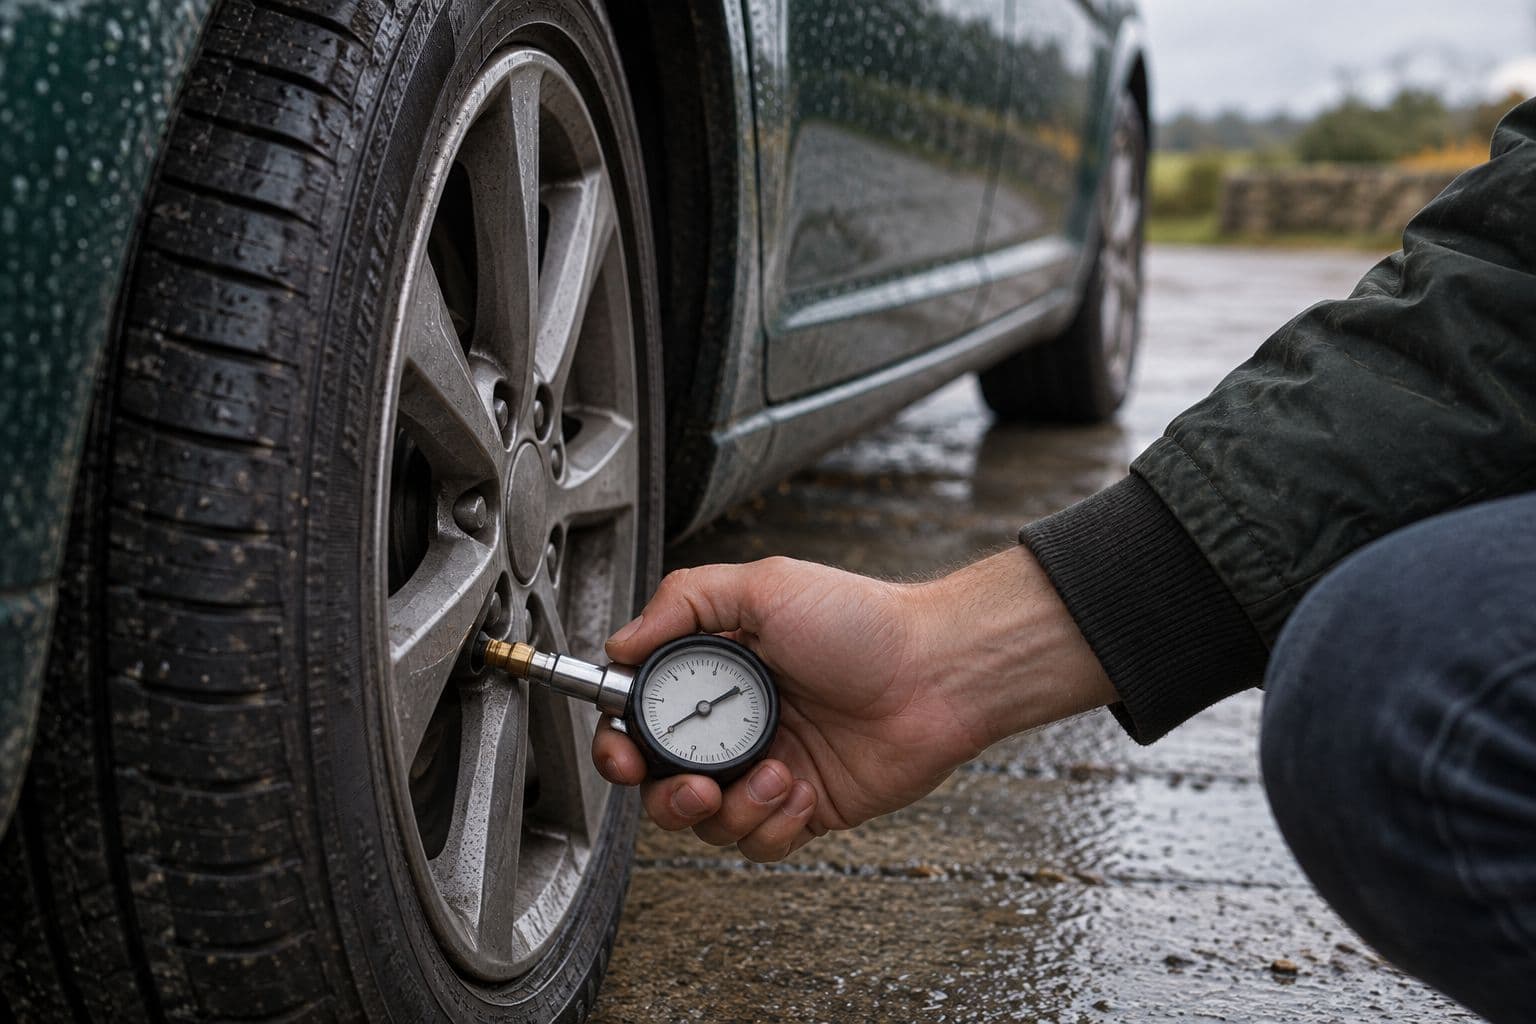
- Tyre pressure. Keeping tyres at the right pressure improves economy by 0.6% on average, up to 3%. Under-inflated tyres lose about 0.2% for every 1 psi drop across all four.
- Weight. About 1% for every extra 100 lb you carry, on a 3,200 lb car. Clear out what you don't need to carry.
- Roof boxes. A rear-mounted box or tray costs much less, only 1–2% in town and 1–5% on the highway. Take a roof box off when you're not using it.
- Motor oil. The grade your manufacturer recommends improves economy by 1–2%.
When the number drops for no reason
Economy moves with the seasons, the traffic and the trips you take. A drop that lasts several tanks, with no change in how or where you drive, is worth a look: check the tyre pressures first, then have the car seen to. A figure you track is often the first sign.
Sources
- fueleconomy.gov, Gas Mileage Tips: Driving More Efficiently (aggressive driving, speed, weight, cargo boxes, idling).
- fueleconomy.gov, Gas Mileage Tips: Keeping Your Vehicle in Shape (tyre pressure, motor oil).
- NIST, Guide to the SI, Appendix B.8 (mpg and L/100 km).